Slide 1: Diffusion Model and Its Applications
- Title: Diffusion Model and its applications
- Presenter: Jungmook Kang
- Event: StatLet Seminar
- Date: 9/4/2026
Slide 2: Reference & Resources
- MIT EECS 6.S183, 6.S184
- Ho et al. (2020), Denoising Diffusion Probabilistic Models
- Song et al. (2021), Denoising Diffusion Implicit Models
- Material:
mookjsi.github.io/posts/diffusion2
Slide 3: 1. Introduction
- Section 1 introduces the basic generative modeling perspective behind diffusion models.
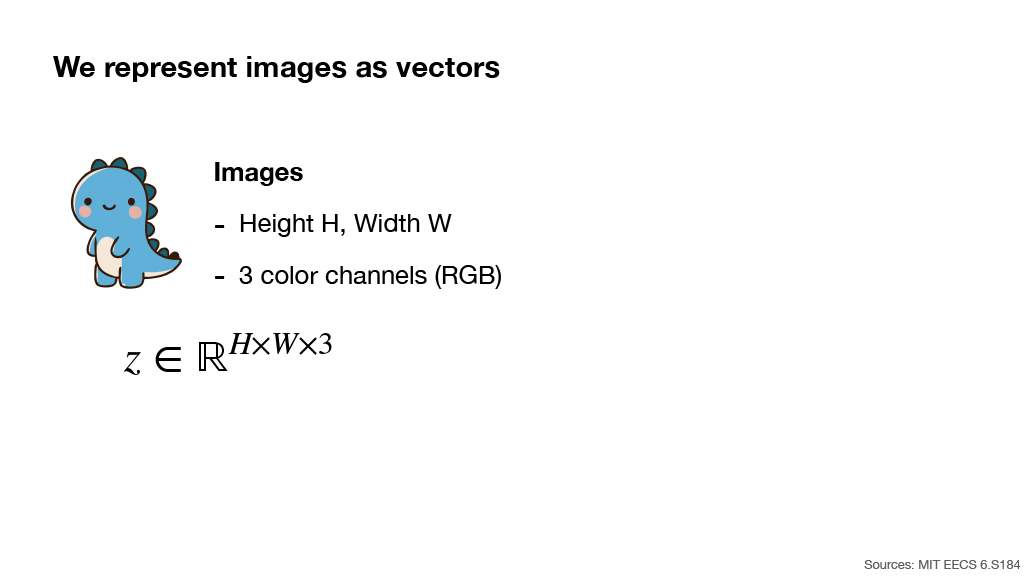
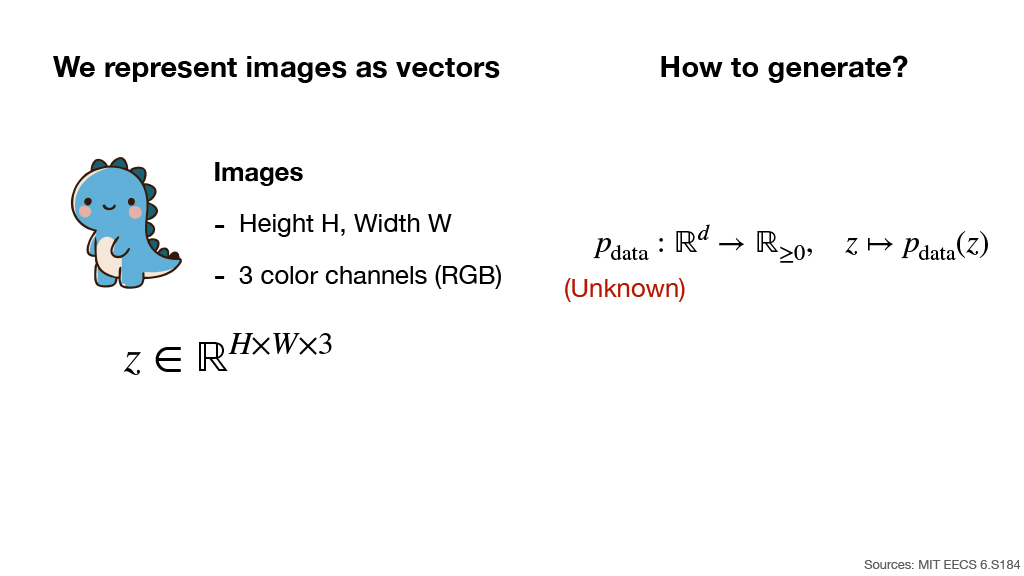
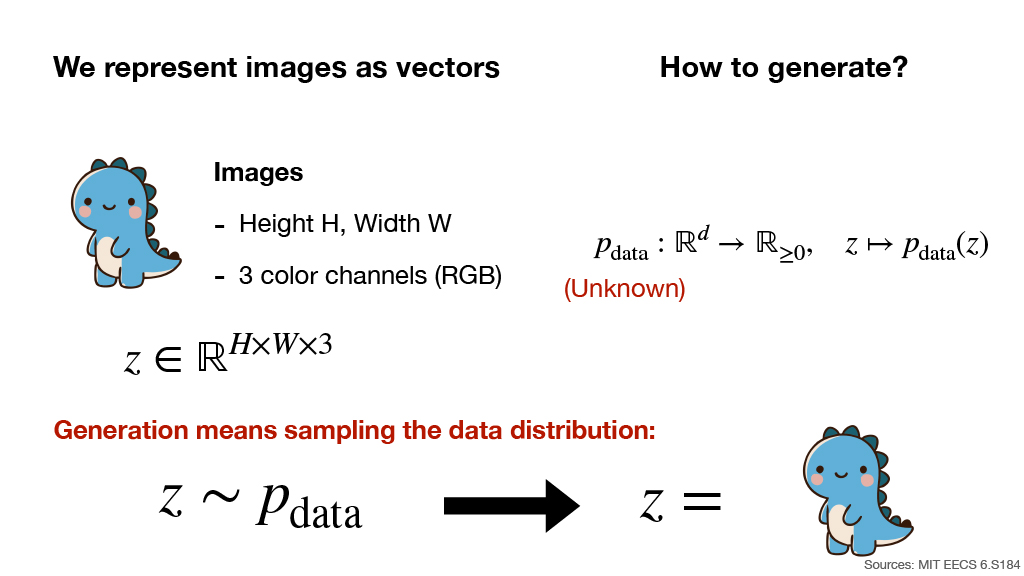
Slide 4-6: Representing Images and the Goal of Generation
Images can be represented as high-dimensional vectors.
- Height: $H$
- Width: $W$
- Color channels: 3 channels (RGB)
Suppose the true data distribution is
However, $p_{\text{data}}$ itself is unknown.
The goal of generation is to sample an image from this unknown data distribution:
- Slide 6 illustrates this idea by showing a sample drawn from $p_{\text{data}}$ becoming a generated image.
- Source: MIT EECS 6.S184
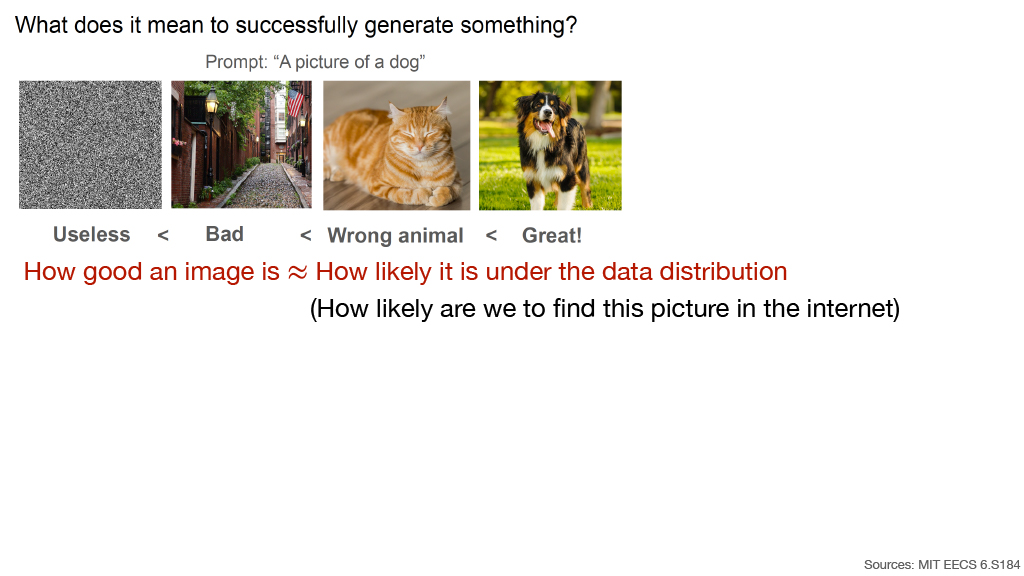
Slide 7-8: What Does Successful Generation Mean?
Example prompt:
“A picture of a dog”
The slide compares four outputs:
- Random noise — Useless
- An unrelated street image — Bad
- A cat image — Wrong animal
- A dog image — Great!
The central intuition is:
How good an image is ≈ How likely it is under the data distribution.
Another interpretation:
How likely are we to find this picture on the internet?
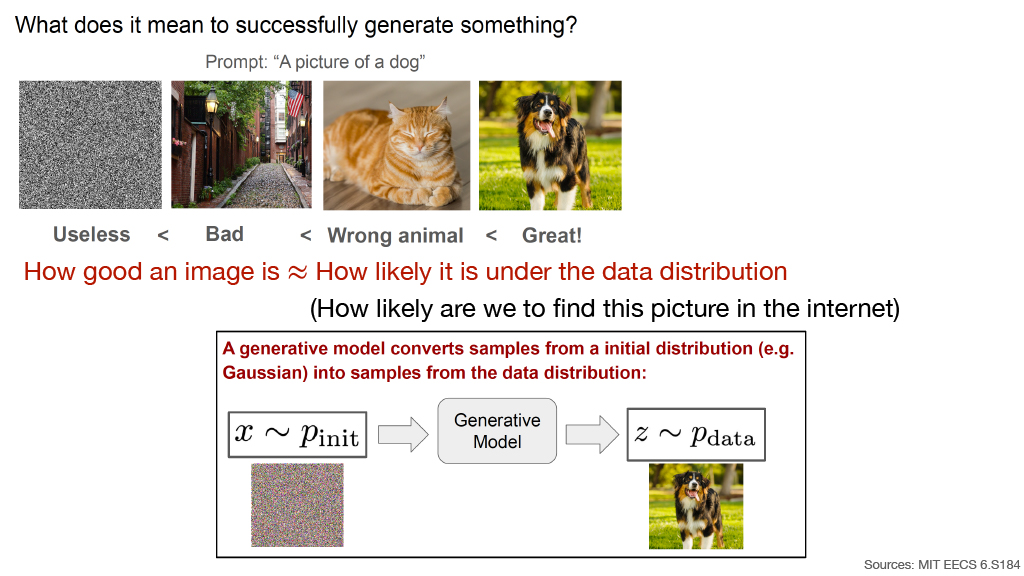
A generative model converts samples from a simple initial distribution, such as a Gaussian distribution, into samples resembling the data distribution.
- The initial sample is visualized as noise.
- The final sample is visualized as a realistic dog image.
- Source: MIT EECS 6.S184
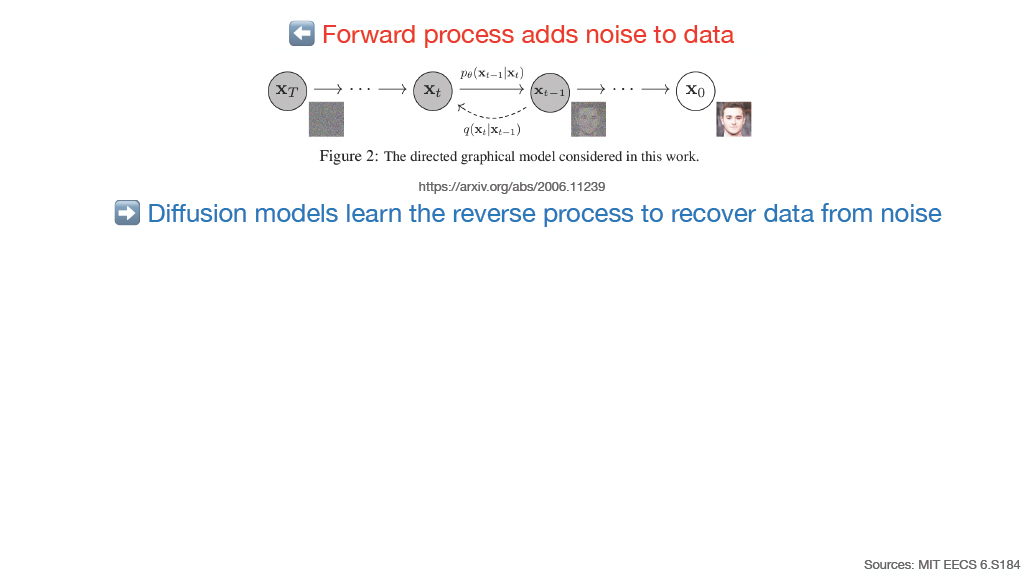
Slide 9-10: Forward and Reverse Diffusion Processes
Reference:
https://arxiv.org/abs/2006.11239
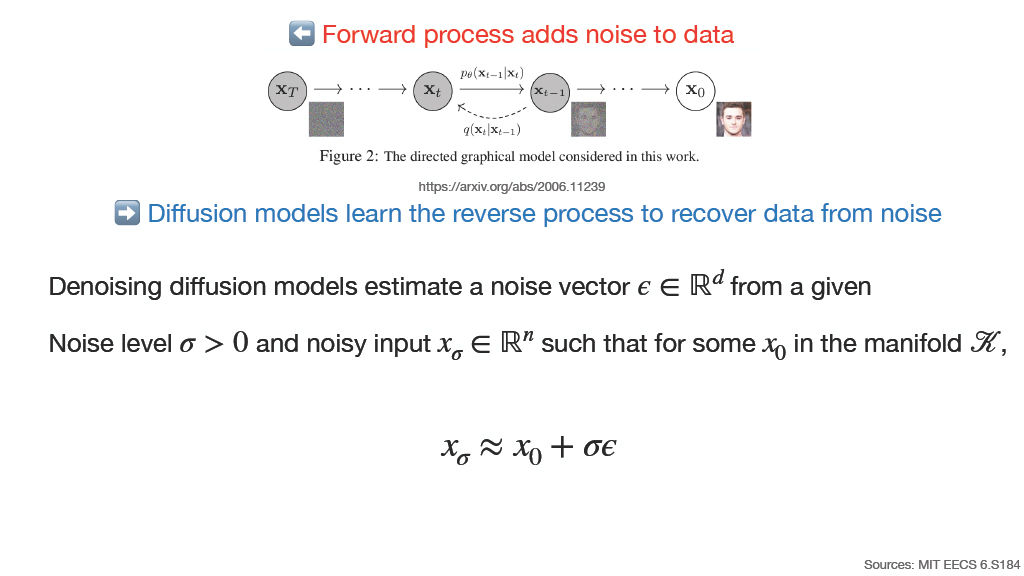
The DDPM graphical model illustrates a sequence from clean data $x_0$ toward increasingly noisy states $x_1,\ldots,x_T$.
- ⬅ Forward process adds noise to data
- ➡ Diffusion models learn the reverse process to recover data from noise
Denoising diffusion models estimate a noise vector
from a given noise level
and noisy input
such that, for some clean point $x_0$ on the data manifold $\mathcal K$,
- Source: MIT EECS 6.S184
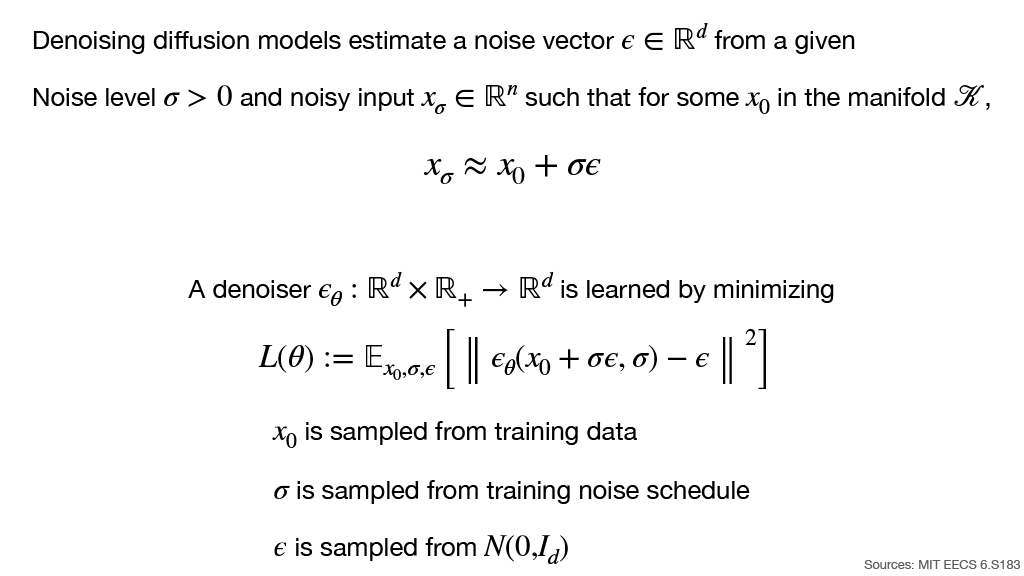
Slide 11: Learning a Noise Predictor
A denoiser is represented as
It is trained by minimizing the expected noise-prediction error:
During training:
- $x_0$ is sampled from the training data.
- $\sigma$ is sampled from the training noise schedule.
- $\epsilon$ is sampled from a standard Gaussian distribution:
The noisy input given to the model is therefore
- Source: MIT EECS 6.S183
Slide 12: 2. Algorithms
- Section 2 describes concrete training and sampling algorithms for a simple diffusion model.
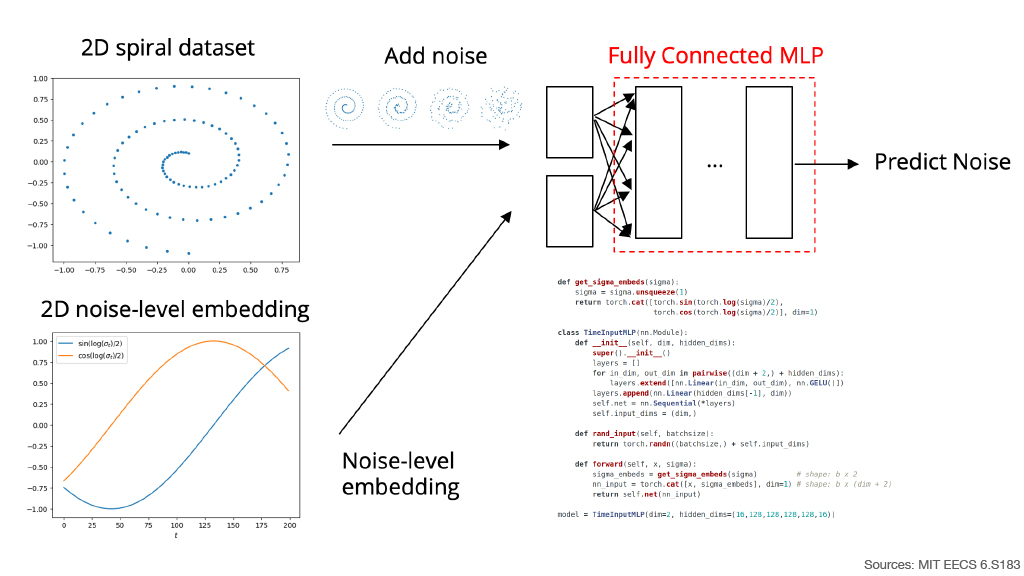
Slide 13: A Toy 2D Diffusion Model
The model is demonstrated using a 2D spiral dataset.
Pipeline:
- Start with points on a 2D spiral.
- Add different amounts of Gaussian noise.
- Embed the noise level.
- Feed both the noisy point and noise-level embedding into a fully connected MLP.
- Predict the noise.
The noise-level embedding is two-dimensional and is visualized using sinusoidal functions:
The slide contains the following model implementation:
def get_sigma_embeds(sigma):
    sigma = sigma.unsqueeze(1)
    return torch.cat([
        torch.sin(torch.log(sigma) / 2),
        torch.cos(torch.log(sigma) / 2)
    ], dim=1)


class TimeInputMLP(nn.Module):
    def __init__(self, dim, hidden_dims):
        super().__init__()
        layers = []

        for in_dim, out_dim in pairwise((dim + 2,) + hidden_dims):
            layers.extend([nn.Linear(in_dim, out_dim), nn.GELU()])

        layers.append(nn.Linear(hidden_dims[-1], dim))
        self.net = nn.Sequential(*layers)
        self.input_dims = (dim,)

    def rand_input(self, batchsize):
        return torch.randn((batchsize,) + self.input_dims)

    def forward(self, x, sigma):
        sigma_embeds = get_sigma_embeds(sigma)  # shape: b x 2
        nn_input = torch.cat([x, sigma_embeds], dim=1)  # shape: b x (dim + 2)
        return self.net(nn_input)


model = TimeInputMLP(
    dim=2,
    hidden_dims=(16, 128, 128, 128, 128, 16)
)
- Source: MIT EECS 6.S183
Slide 14: Training the Noise-Prediction Model
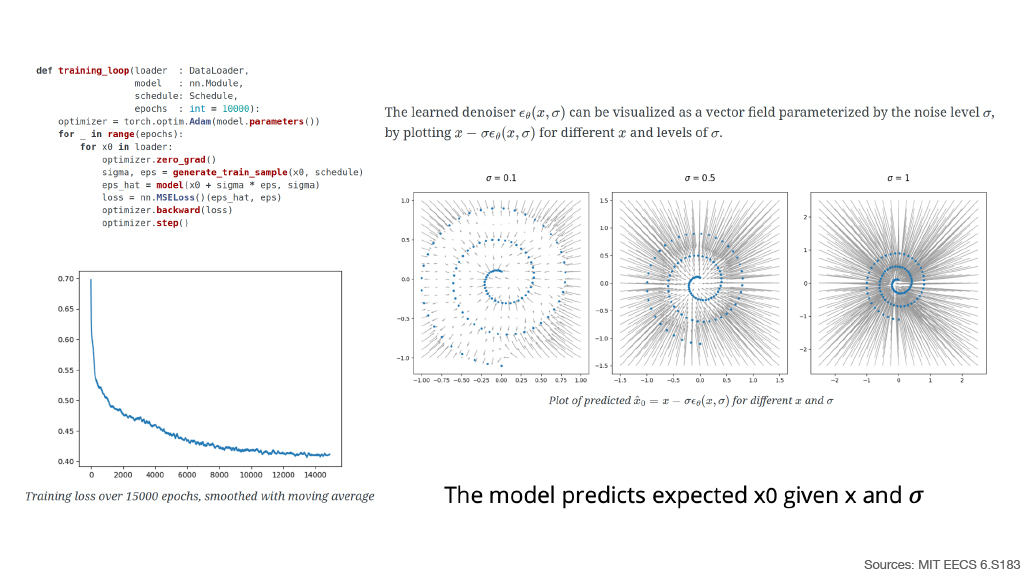
The training loop repeatedly generates noisy samples and minimizes mean squared error between predicted and true noise.
def training_loop(loader: DataLoader,
                  model: nn.Module,
                  schedule: Schedule,
                  epochs: int = 10000):

    optimizer = torch.optim.Adam(model.parameters())

    for _ in range(epochs):
        for x0 in loader:
            optimizer.zero_grad()

            sigma, eps = generate_train_sample(x0, schedule)

            eps_hat = model(x0 + sigma * eps, sigma)

            loss = nn.MSELoss()(eps_hat, eps)

            optimizer.backward(loss)
            optimizer.step()
The slide shows the training loss over approximately 15,000 epochs, smoothed using a moving average. The loss gradually decreases during training.
The learned denoiser
can be visualized as a vector field parameterized by the noise level $\sigma$.
The visualization plots
for different $x$ and different values of $\sigma$:
- $\sigma=0.1$
- $\sigma=0.5$
- $\sigma=1$
The central interpretation is:
The model predicts expected $x_0$ given $x$ and $\sigma$.
- Source: MIT EECS 6.S183
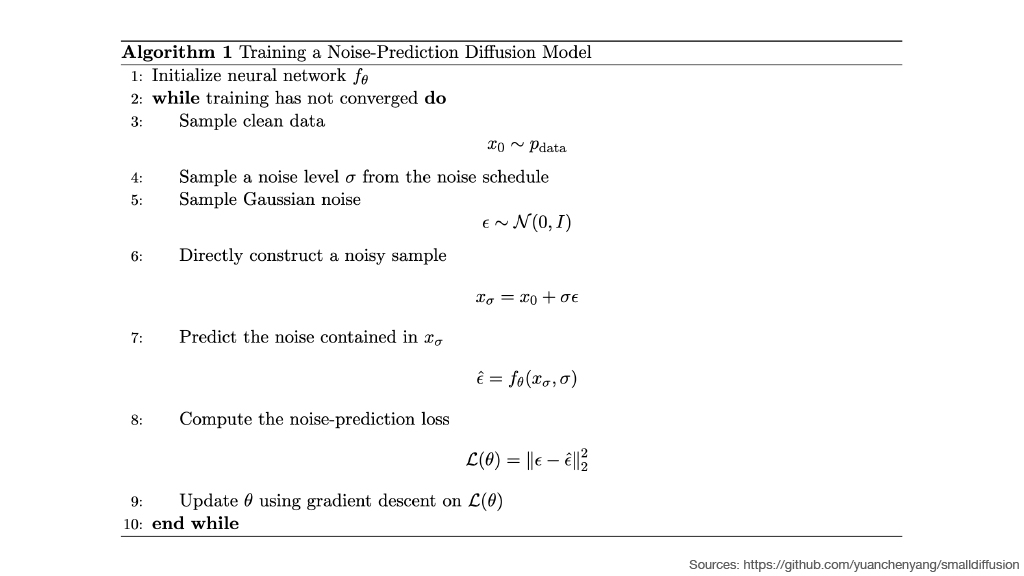
Slide 15: Algorithm 1 — Training a Noise-Prediction Diffusion Model
Algorithm 1: Training a Noise-Prediction Diffusion Model
- Initialize neural network $f_\theta$.
- While training has not converged:
- Sample clean data:
- Sample a noise level $\sigma$ from the noise schedule.
- Sample Gaussian noise:
- Directly construct a noisy sample:
- Predict the noise contained in $x_\sigma$:
- Compute the noise-prediction loss:
- Update $\theta$ using gradient descent on $\mathcal L(\theta)$.
- End while.
- Source:
https://github.com/yuanchenyang/smalldiffusion
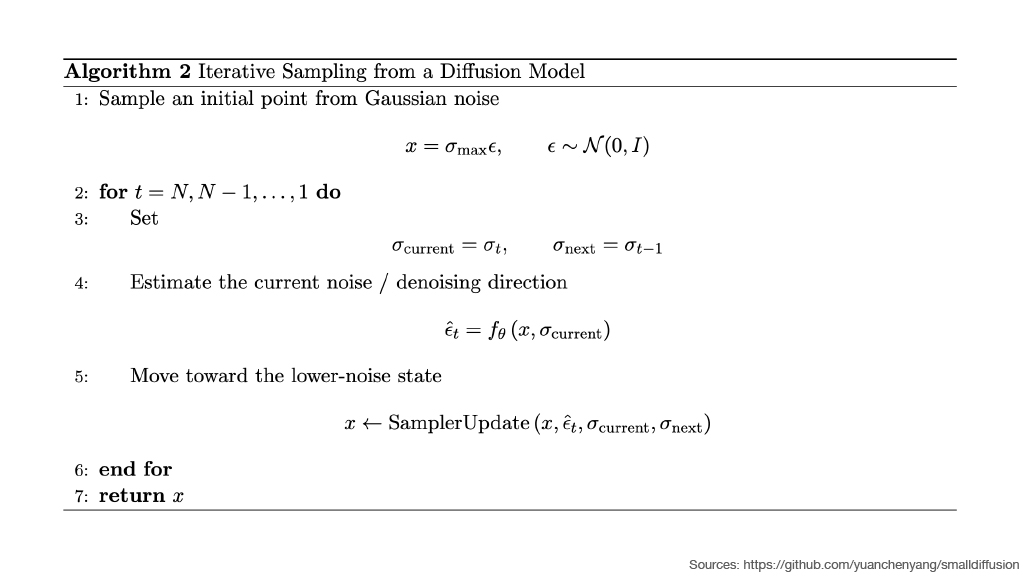
Slide 16: Algorithm 2 — Iterative Sampling from a Diffusion Model
Algorithm 2: Iterative Sampling from a Diffusion Model
- Sample an initial point from Gaussian noise:
- For
do:
- Set
- Estimate the current noise / denoising direction:
- Move toward the lower-noise state:
- End for.
- Return $x$.
- Source:
https://github.com/yuanchenyang/smalldiffusion
Slide 17: 3. Training Details
- Section 3 examines the mathematical structure of the optimal denoiser learned by the noise-prediction objective.
Slide 18: The Ideal Denoiser
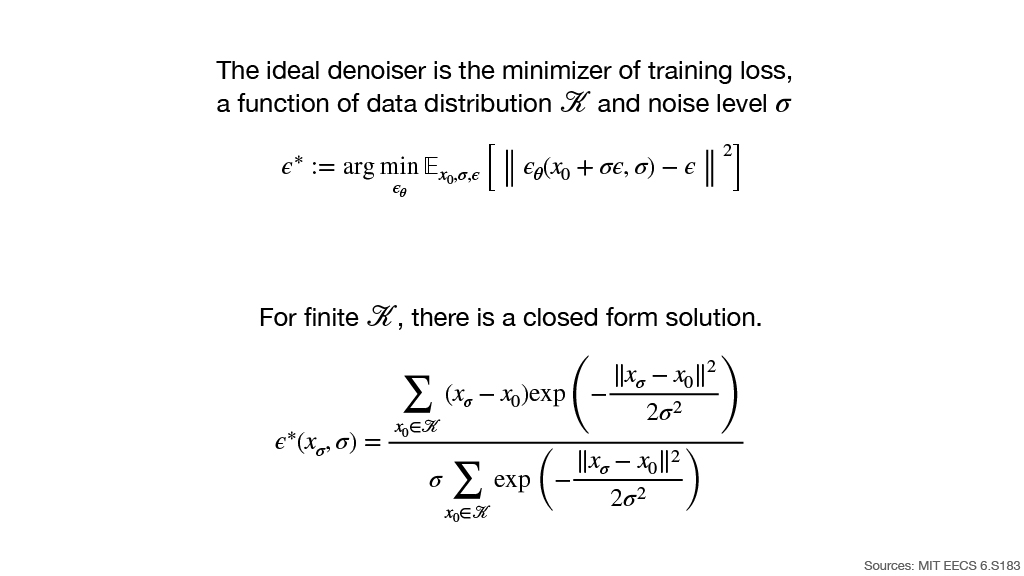
The ideal denoiser is defined as the minimizer of the training objective:
For a finite dataset or manifold representation $\mathcal K$, the optimal predictor has a closed-form solution:
Key points:
The ideal denoiser is the minimizer of the training loss.
It is a function of both the data distribution $\mathcal K$ and the noise level $\sigma$.
For finite $\mathcal K$, there is a closed-form solution.
Source: MIT EECS 6.S183
Slide 19: Denoising Vector Fields at Different Noise Levels
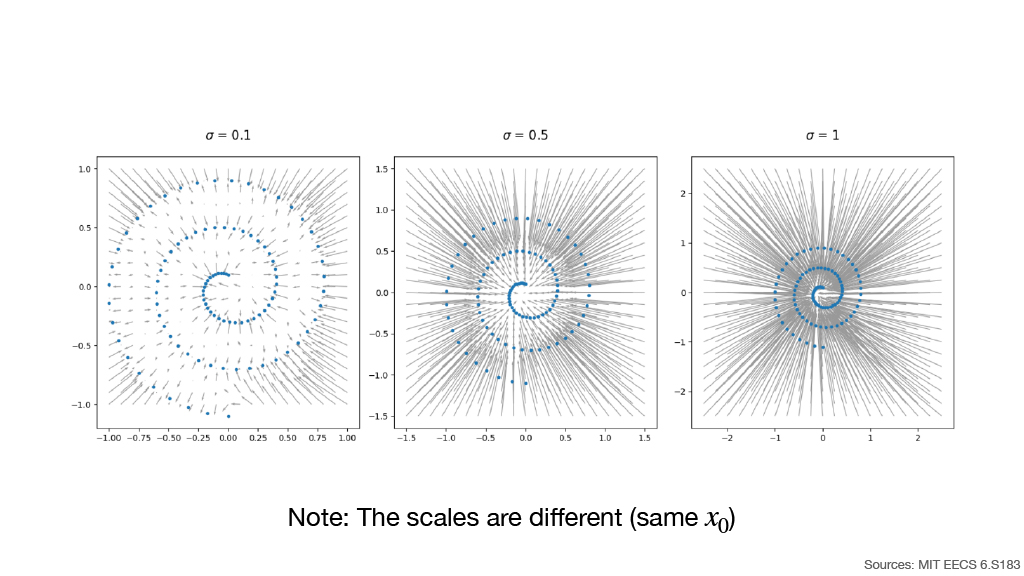
The slide visualizes the predicted denoising direction for the same underlying $x_0$ using three noise levels:
- $\sigma=0.1$
- $\sigma=0.5$
- $\sigma=1$
As $\sigma$ increases:
- The region being considered becomes larger.
- The denoising vectors aggregate information over a broader neighborhood of the data manifold.
- For small $\sigma$, the denoising direction is much more local.
Note: The scales are different (same $x_0$).
- Source: MIT EECS 6.S183
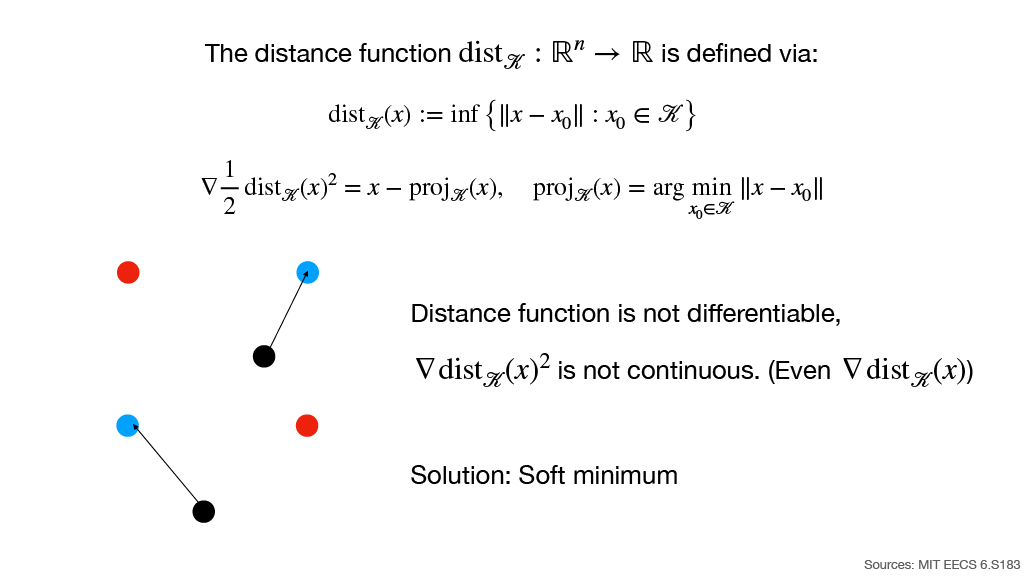
Slide 20-21: Distance to the Data Manifold
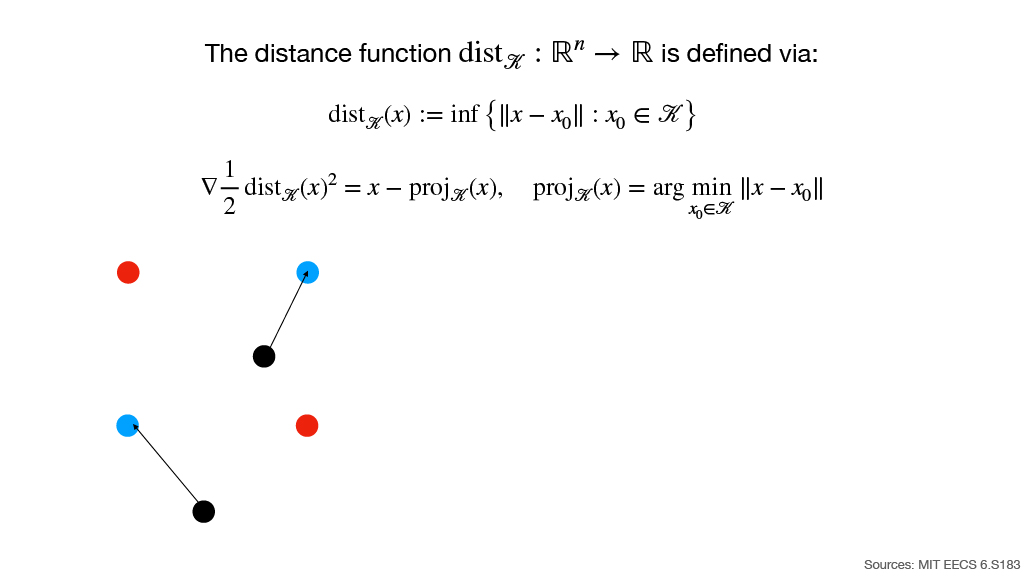
The distance function
is defined as
The gradient of the squared distance is related to projection onto the data manifold:
where
However, this construction causes a problem:
- The distance function is not differentiable everywhere.
- $\nabla\operatorname{dist}_{\mathcal K}(x)^2$ is not continuous.
The proposed solution is:
Soft minimum
- Source: MIT EECS 6.S183
Slide 22-23: Gaussian-Smoothed Distance Function
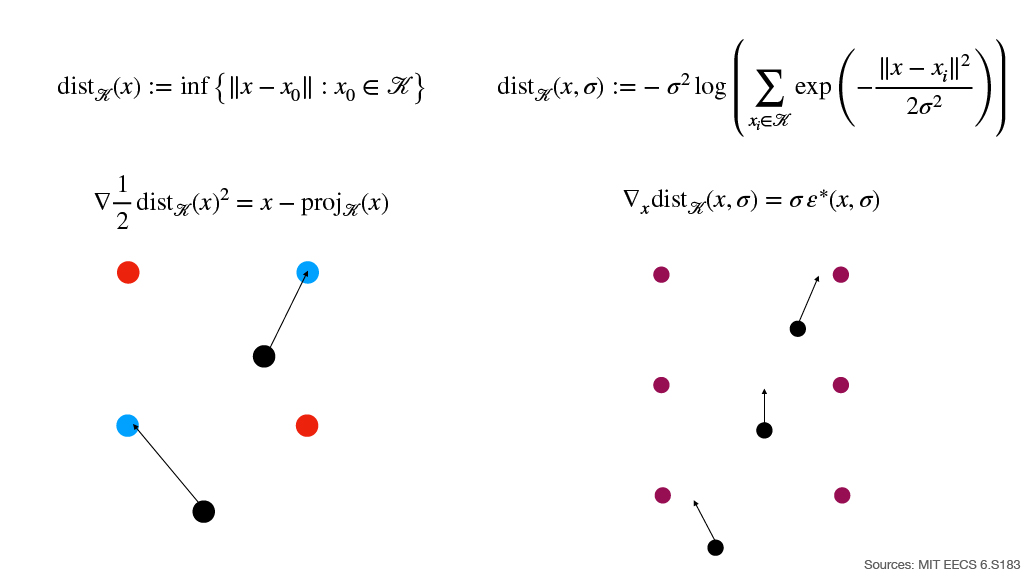
Instead of the hard minimum, define a smooth approximation:
Its gradient satisfies
For comparison, the original hard distance was
with
Therefore:
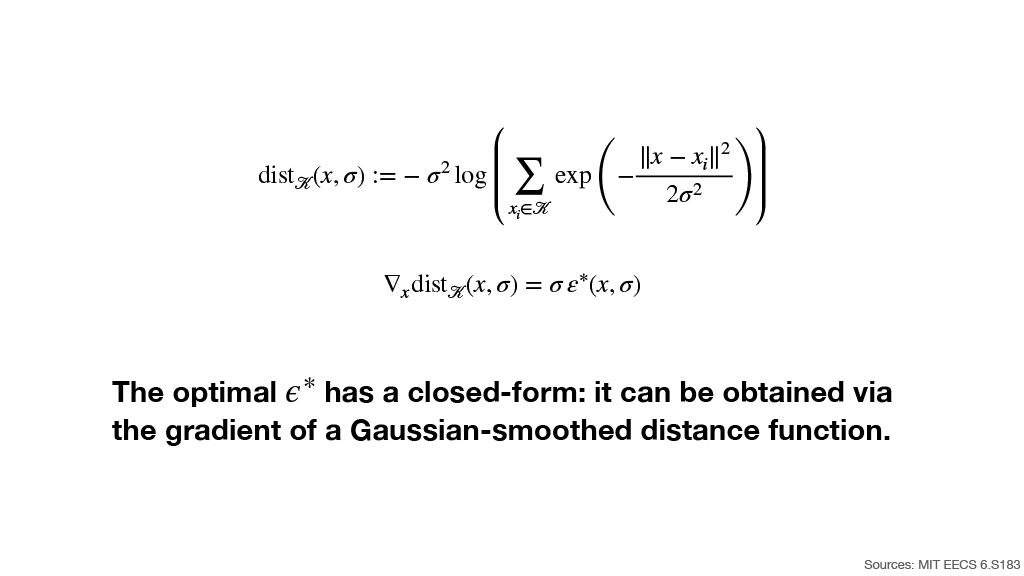
The optimal $\epsilon^*$ has a closed form: it can be obtained via the gradient of a Gaussian-smoothed distance function.
- Source: MIT EECS 6.S183
Slide 24: 4. Sampling Details
- Section 4 explains how the trained denoiser is used to iteratively move a noisy sample toward the data distribution.
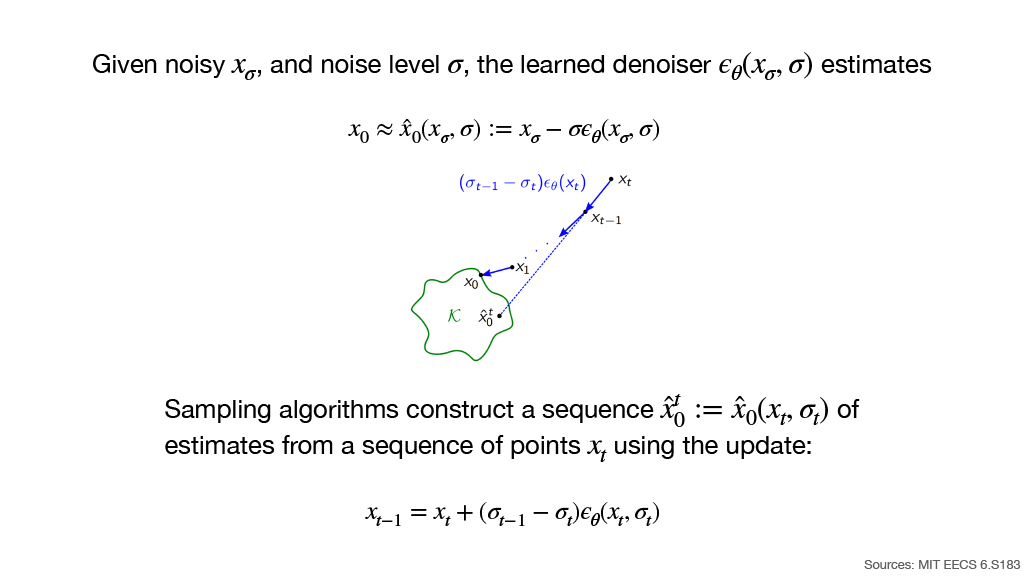
Slide 25: From Noise Prediction to a Clean-Data Estimate
Given noisy $x_\sigma$ and noise level $\sigma$, the learned denoiser predicts
This produces an estimate of the underlying clean sample:
The diagram visualizes:
- The current noisy point $x_t$.
- An estimate $\hat{x}_0^t$ on or near the data manifold $\mathcal K$.
- The next point $x_{t-1}$, obtained by moving along the predicted denoising direction.
- Repeating this process progressively approaches the manifold.
Sampling algorithms construct a sequence of clean-data estimates
from a sequence $x_t$ using
- Source: MIT EECS 6.S183
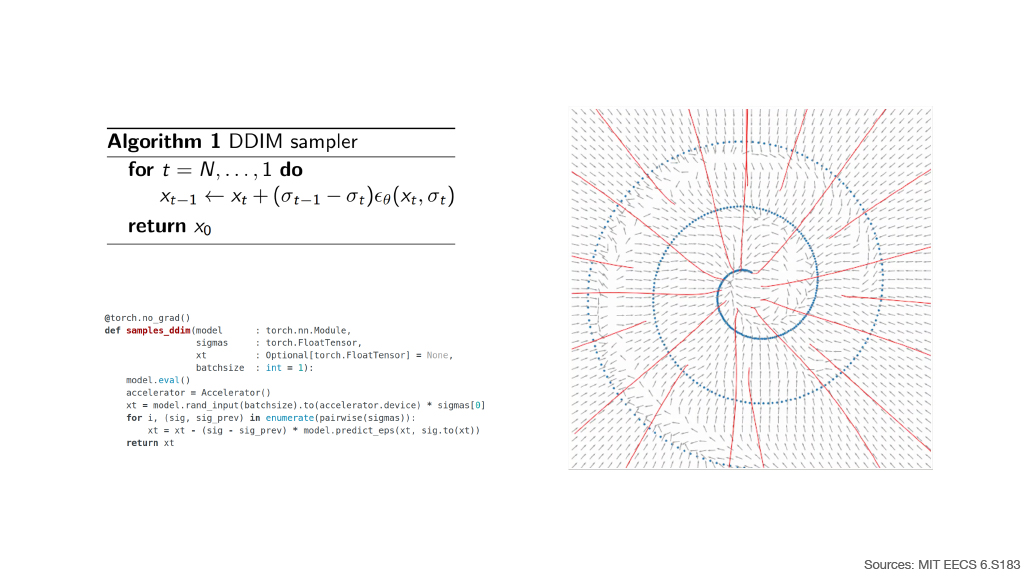
Slide 26: DDIM Sampler
The DDIM sampler repeatedly applies the deterministic update
Algorithm:
Algorithm 1 DDIM sampler

for t = N, ..., 1 do
    x_{t-1} ← x_t + (σ_{t-1} - σ_t) ε_θ(x_t, σ_t)

return x_0
The slide also contains an implementation of the sampler and a vector-field visualization.
The red sampling trajectories start from high-noise regions and iteratively follow the denoising vector field toward the spiral-shaped data manifold.
- Source: MIT EECS 6.S183
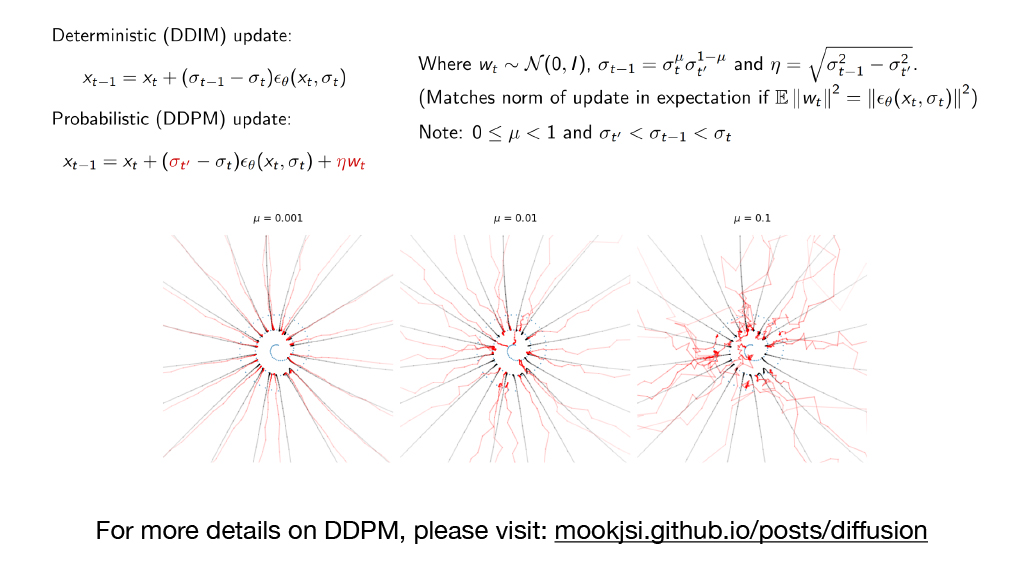
Slide 27: Deterministic DDIM vs. Probabilistic DDPM
Deterministic DDIM Update
Probabilistic DDPM Update
where
and
The noise scale is chosen so that the norm of the stochastic update matches the denoising update in expectation when
The slide notes:
Three visual examples compare sampling trajectories for:
- $\mu=0.001$
- $\mu=0.01$
- $\mu=0.1$
As $\mu$ increases, the trajectories become progressively more stochastic.
For more details on DDPM, please visit:
mookjsi.github.io/posts/diffusion
Slide 28: 5. Conditional Sampling
- Section 5 extends unconditional diffusion models to conditional generation.
Slide 29: How Can We Sample Conditionally?
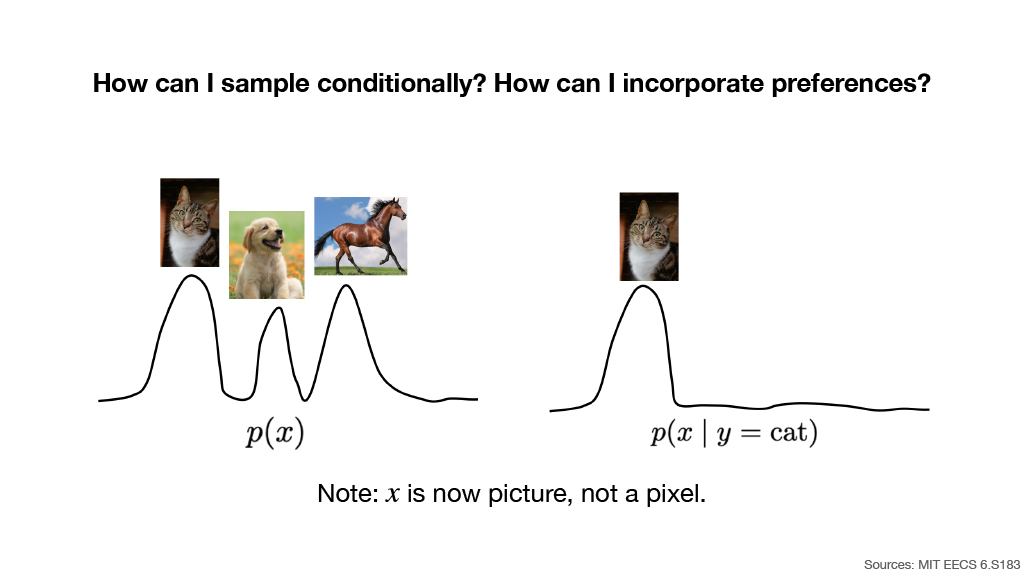
The main questions are:
How can I sample conditionally? How can I incorporate preferences?
The slide contrasts:
with a conditional distribution such as
The unconditional distribution contains several types of images, including:
- Cat
- Dog
- Horse
Conditioning on $y=\text{cat}$ restricts generation toward the cat mode.
Note: $x$ is now a picture, not a pixel.
- Source: MIT EECS 6.S183
Slide 30: Conditional Score Matching
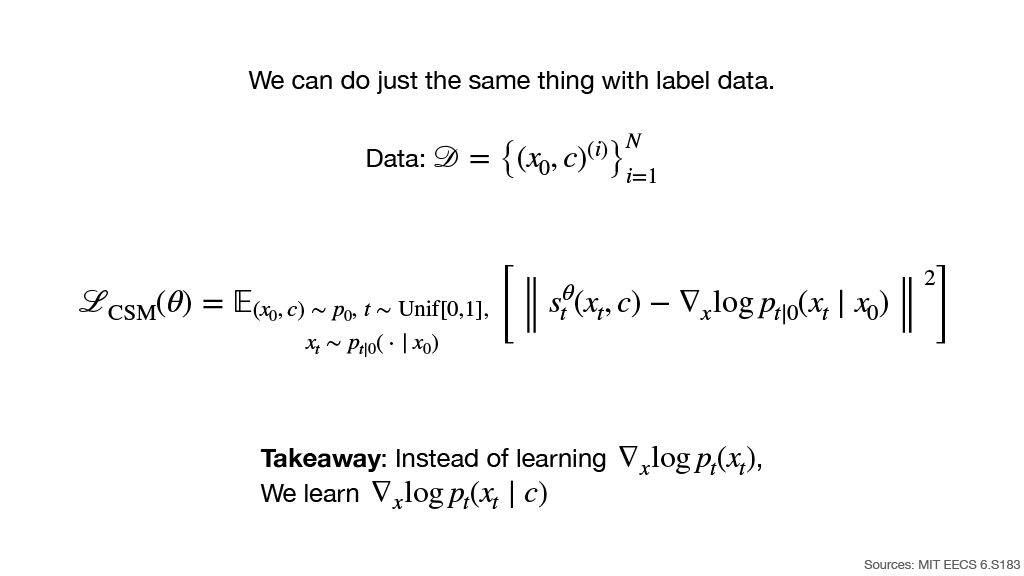
The same idea can be applied when labels are available.
Dataset:
The conditional score-matching objective is
The key takeaway is that instead of learning the unconditional score
we learn the conditional score
- Source: MIT EECS 6.S183
Slide 31: Conditional and Unconditional ODE Flows
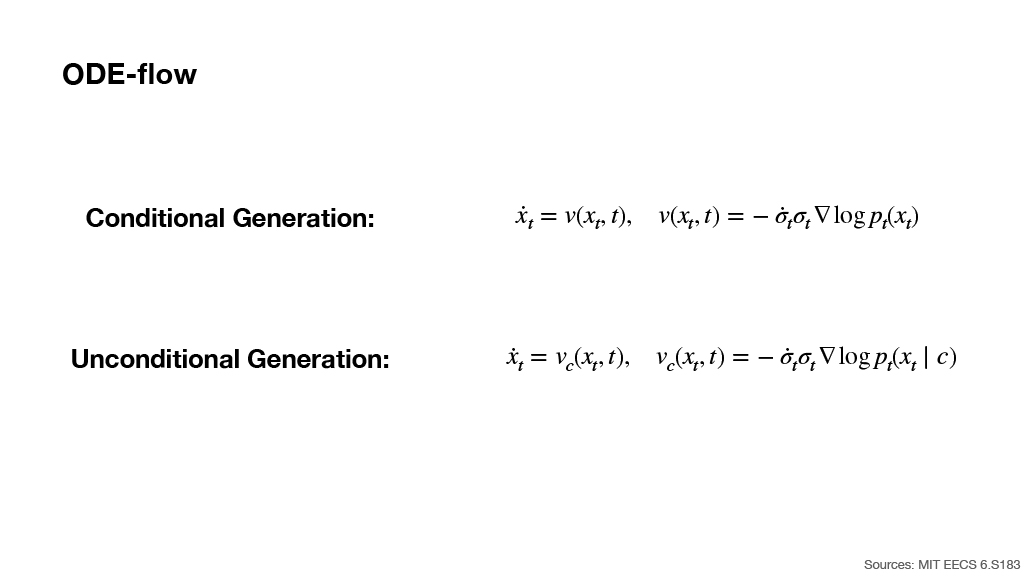
Unconditional Generation
where
Conditional Generation
where
Thus, conditional generation modifies the ODE vector field by replacing the unconditional score with the conditional score.
- Source: MIT EECS 6.S183
Slide 32: 6. Latent Diffusion Models
- Section 6 introduces latent diffusion, where the diffusion process is performed in a lower-dimensional latent representation rather than directly in image space.
Slide 33-34: Latent Diffusion Models — Algorithm
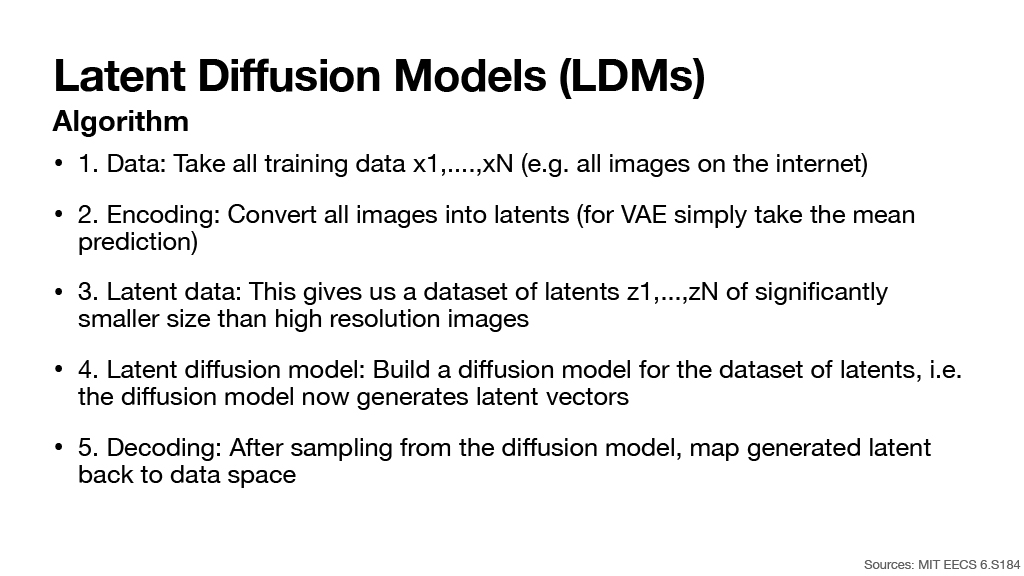
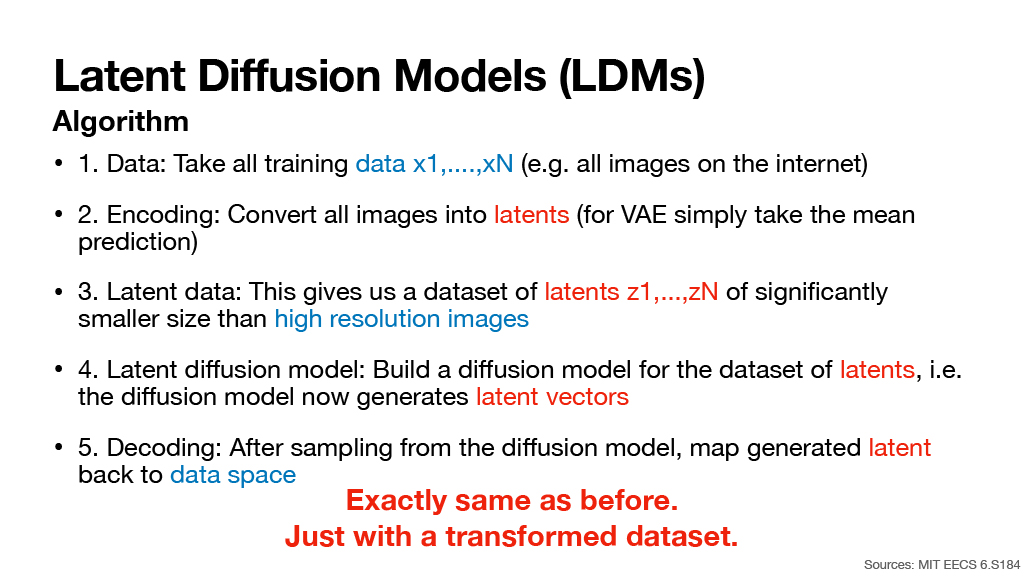
The latent diffusion pipeline consists of five steps.
Data
Take all training data
such as images collected from the internet.
Encoding
Convert all images into latent representations.
- For a VAE, simply take the mean prediction.
Latent Data
This creates a new dataset
whose elements are significantly smaller than the original high-resolution images.
Latent Diffusion Model
Build a diffusion model on the dataset of latent variables.
- The diffusion model now generates latent vectors instead of full-resolution images.
Decoding
After sampling from the diffusion model, map the generated latent representation back into the original data space.
The central message of Slide 34 is:
Exactly same as before. Just with a transformed dataset.
- Source: MIT EECS 6.S184
Slide 35: Why Generate in Latent Space?
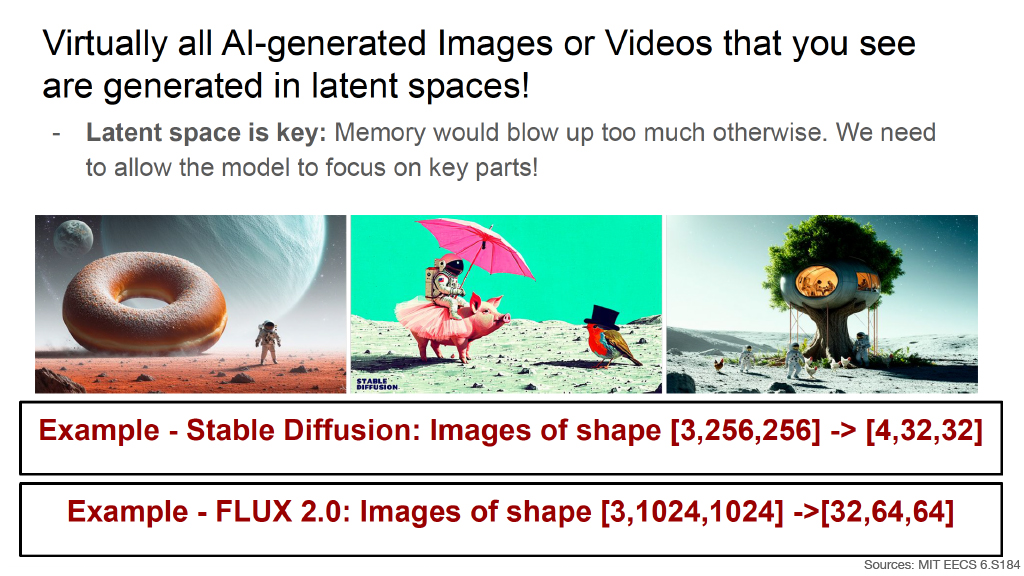
The slide states:
Virtually all AI-generated images or videos that you see are generated in latent spaces!
Why?
- Latent space is key because memory usage would otherwise become prohibitively large.
- A compressed representation also allows the model to focus on important components of the data.
Examples:
Stable Diffusion
Original image representation:
is compressed to:
FLUX 2.0
Original image representation:
is compressed to:
The slide includes three examples of AI-generated imagery to illustrate high-resolution generation from latent representations.
- Source: MIT EECS 6.S184
Slide 36: Parameterizing a Vector Field in a Neural Network
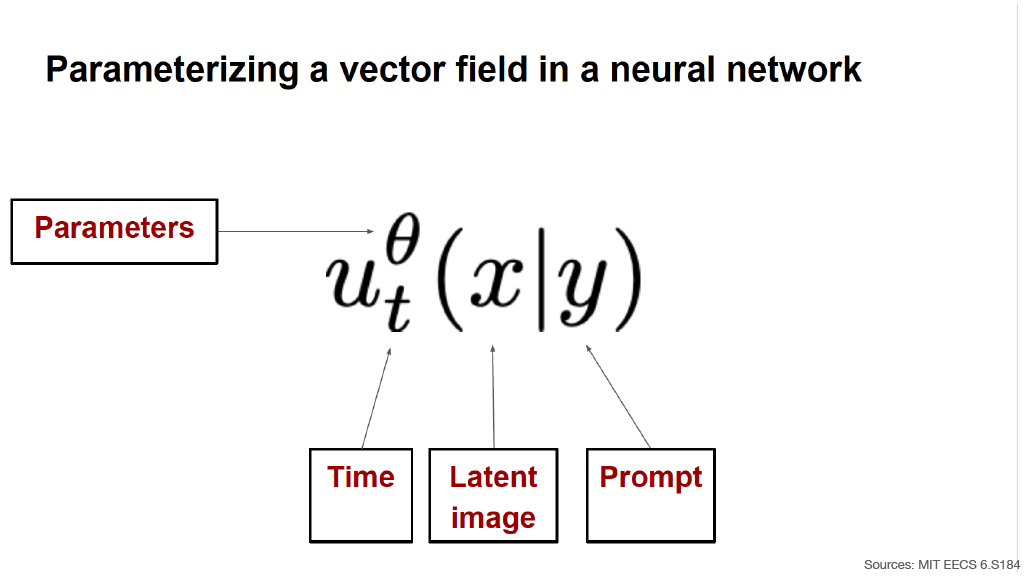
A diffusion model can parameterize a vector field using a neural network:
The network depends on three principal inputs:
- Time
- Latent image
- Prompt
The network parameters are represented by $\theta$.
The diagram therefore expresses a conditional vector field whose behavior depends jointly on:
the current diffusion time,
the current image latent,
and the text condition.
Source: MIT EECS 6.S184
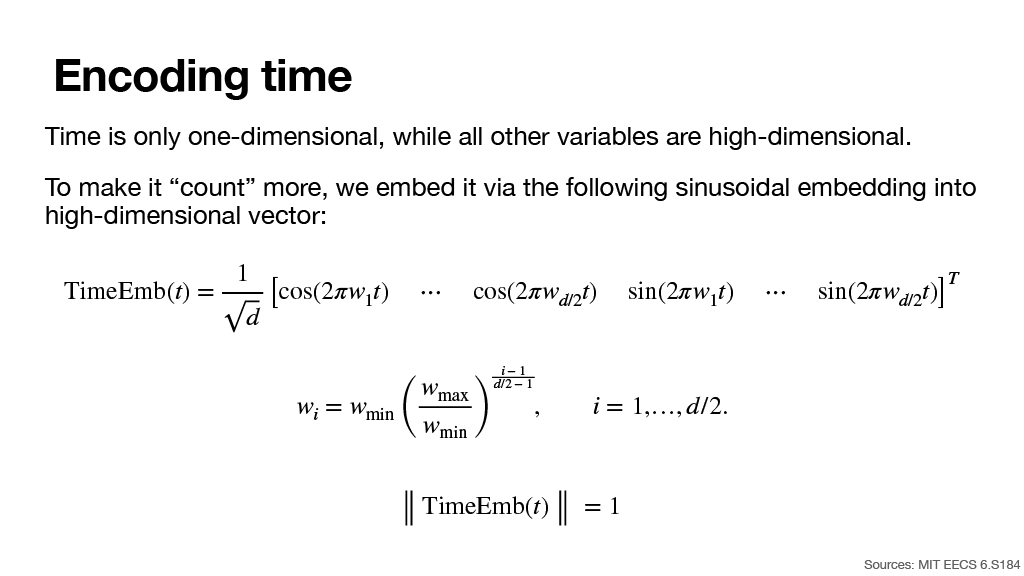
Slide 37: Encoding Time
Time is only one-dimensional, while the other model variables are high-dimensional.
To make the time variable “count” more, it is embedded into a high-dimensional vector using sinusoidal features.
The frequencies are geometrically spaced:
The embedding is normalized:
- Source: MIT EECS 6.S184
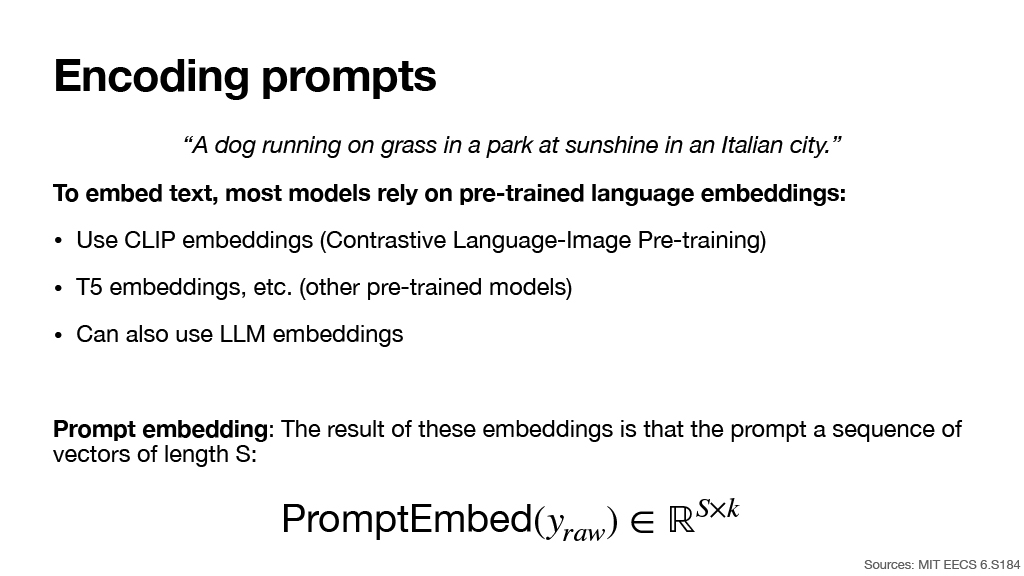
Slide 38: Encoding Prompts
Example prompt:
“A dog running on grass in a park at sunshine in an Italian city.”
Most generative models embed text using pre-trained language or multimodal representations.
Possible choices include:
- CLIP embeddings
- Contrastive Language-Image Pre-training
- T5 embeddings
- Other pre-trained models
- LLM embeddings
The result is a sequence of $S$ vectors:
Here:
$S$ is the sequence length.
$k$ is the dimensionality of each token embedding.
Source: MIT EECS 6.S184
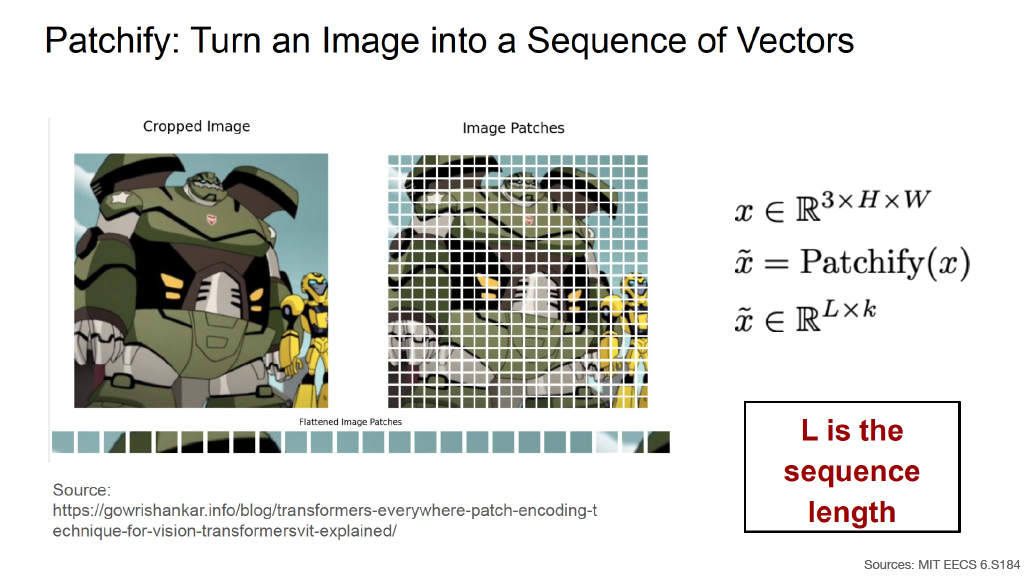
Slide 39: Patchify — Turn an Image into a Sequence of Vectors
Transformers operate naturally on sequences. Therefore, an image can be divided into patches and represented as a sequence.
The original image is represented as
Patchification produces
with
where:
- $L$ is the sequence length.
- $k$ is the dimensionality of each patch vector.
The slide visually shows:
- A cropped image.
- The image divided into a rectangular patch grid.
- The patches flattened into a one-dimensional sequence of vectors.
Image source shown on the slide:
https://glorivishankar.info/blog/transformers-everywhere-patch-encoding-technique-for-vision-transformers-vit-explained/Source: MIT EECS 6.S184
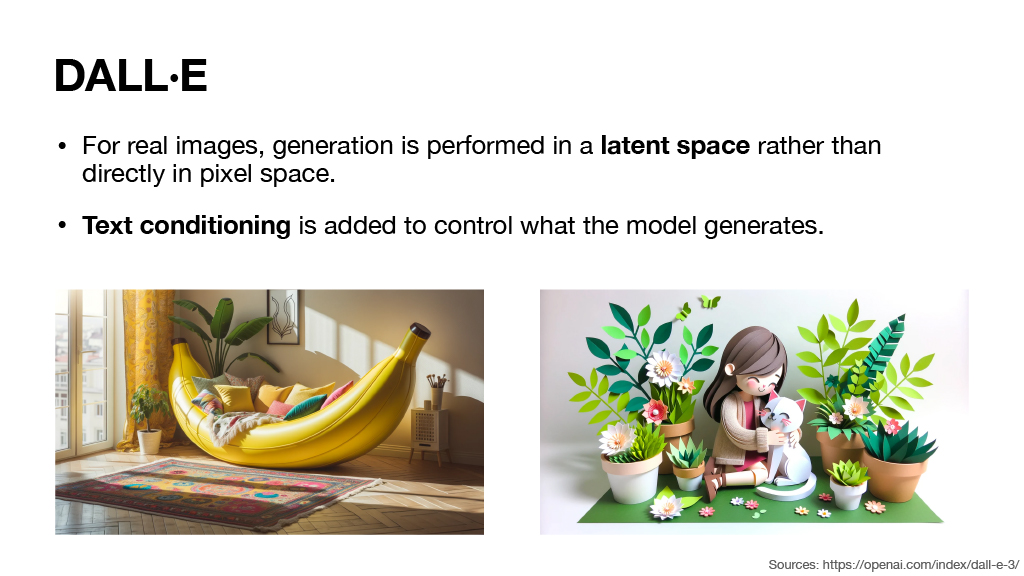
Slide 40: DALL·E
For real images:
- Generation is performed in a latent space rather than directly in pixel space.
- Text conditioning is added to control what the model generates.
The slide shows two examples of generated images:
- A surreal banana-shaped hammock placed inside a room.
- A stylized character surrounded by flowers and plants.
These examples illustrate text-conditioned image synthesis.
- Source:
https://openai.com/index/dall-e-3/
Slide 41: Diffusion Transformer (DiT)
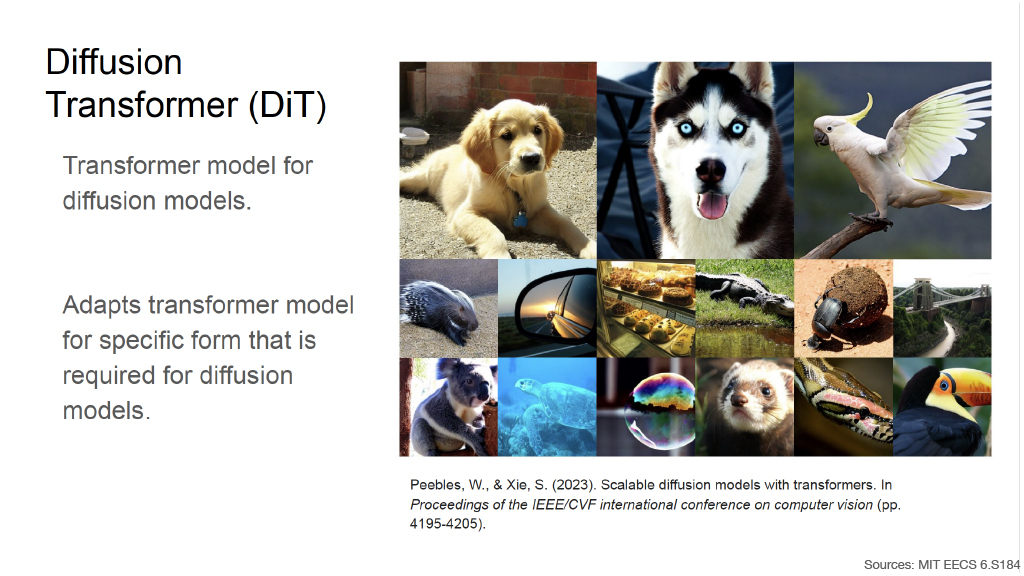
Diffusion Transformer (DiT)
- A Transformer model designed for diffusion models.
- It adapts the Transformer architecture to the specific form required by diffusion models.
The slide shows a collection of generated animal images.
Reference shown on the slide:
Peebles, W., & Xie, S. (2023). Scalable diffusion models with transformers.
Proceedings of the IEEE/CVF International Conference on Computer Vision, pp. 4195–4205.
- Source: MIT EECS 6.S184
Slide 42: MovieGen
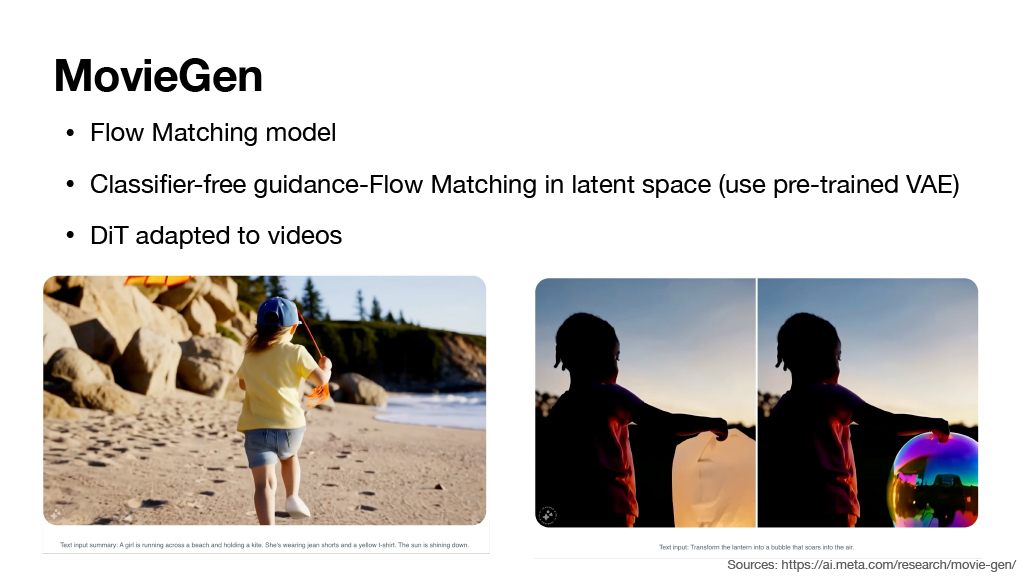
MovieGen combines several of the previously introduced ideas.
- Flow Matching model
- Classifier-free guidance
- Flow Matching is performed in latent space
- A pre-trained VAE is used.
- DiT adapted to videos
The slide shows examples from MovieGen:
A generated video of a person running along a beach or rocky coastal environment.
A video-editing example in which the appearance/content of an object held by a person is modified across frames.
Source:
https://ai.meta.com/research/movie-gen/
Slide 43: Sora
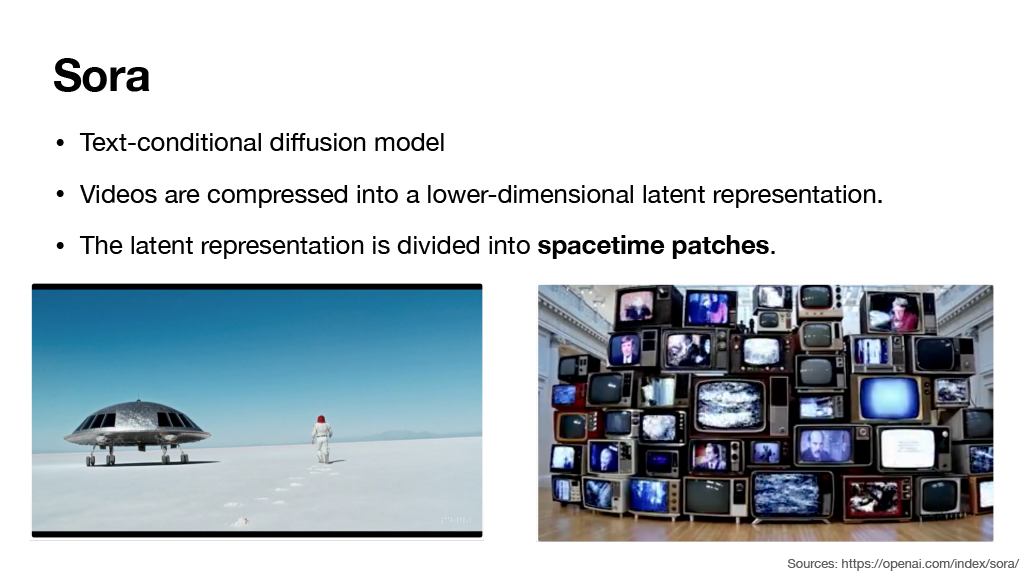
Sora extends the diffusion-model framework to video generation.
- Text-conditional diffusion model
- Videos are compressed into a lower-dimensional latent representation.
- The latent representation is divided into spacetime patches.
This combines three major ideas introduced earlier:
Conditional generation
- Text controls the output.
Latent diffusion
- Generation occurs in a compressed representation instead of full pixel space.
Patch-based Transformer processing
- Video latents are divided into spacetime patches that can be processed as tokens.
The slide contains two Sora examples:
A surreal outdoor scene containing a large futuristic or spacecraft-like object.
A composition consisting of many televisions/screens displaying different visual content.
Source:
https://openai.com/index/sora/